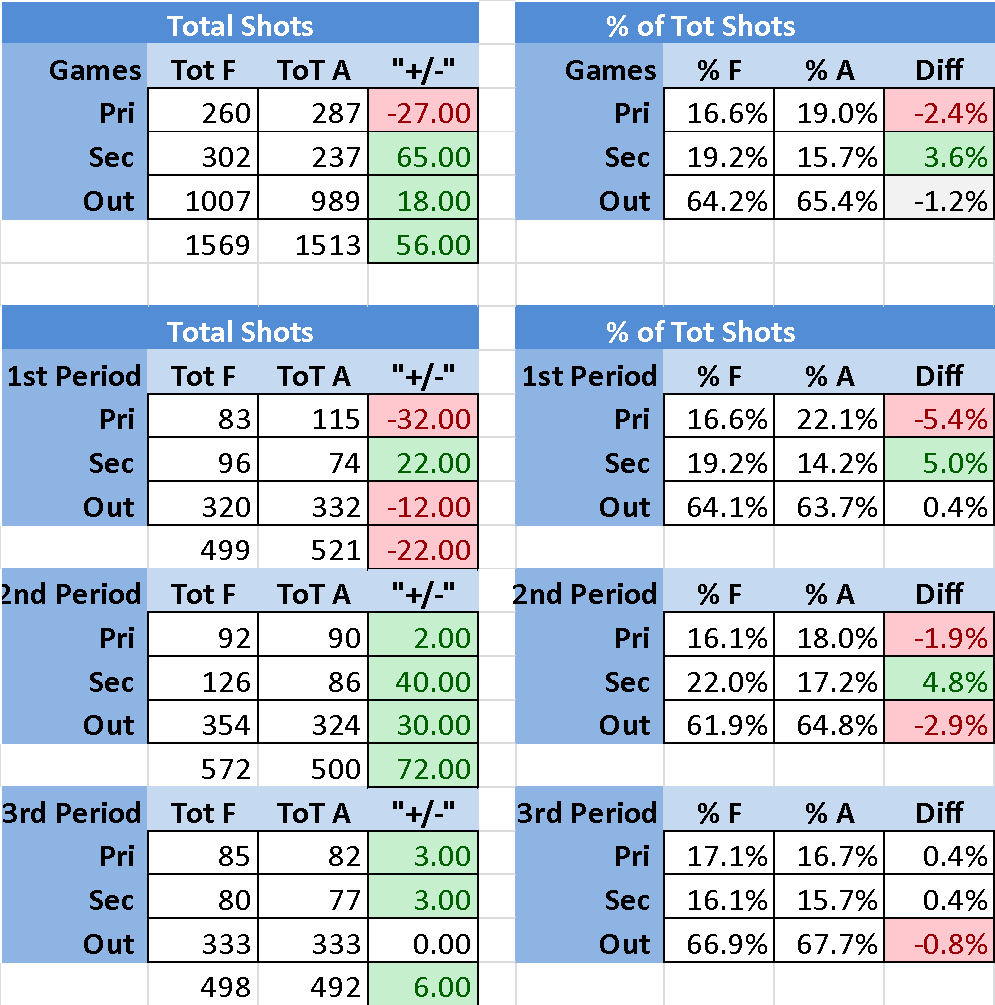
[Left side - Total Shots for the season “For” and “Against”. Right side - the Percentage of Total Shots by zone]

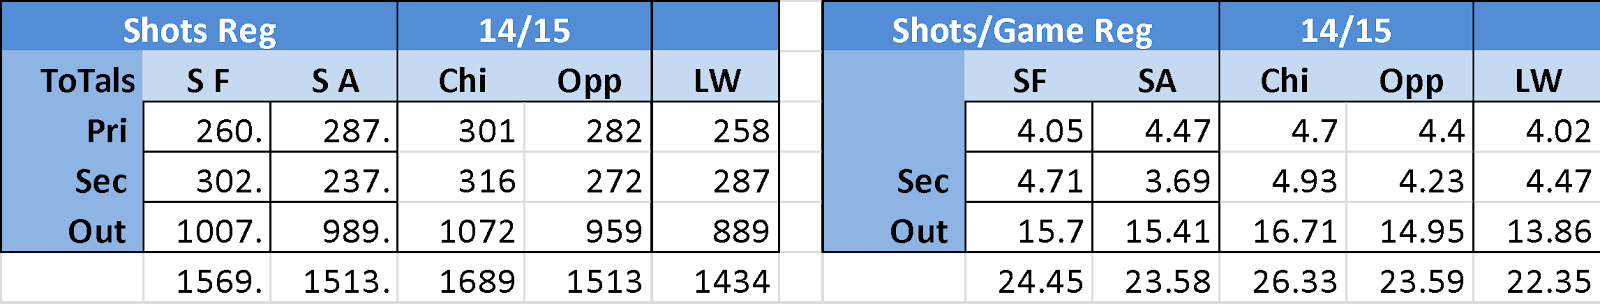
[Left side - Total Shots compared to Last Season and League Average. Right side - same data but per game comparisons]
[Left side - Shooting Percentages by Zone compared to Last Season and League Average. Right side - same data but from Goalie Save perspectives]

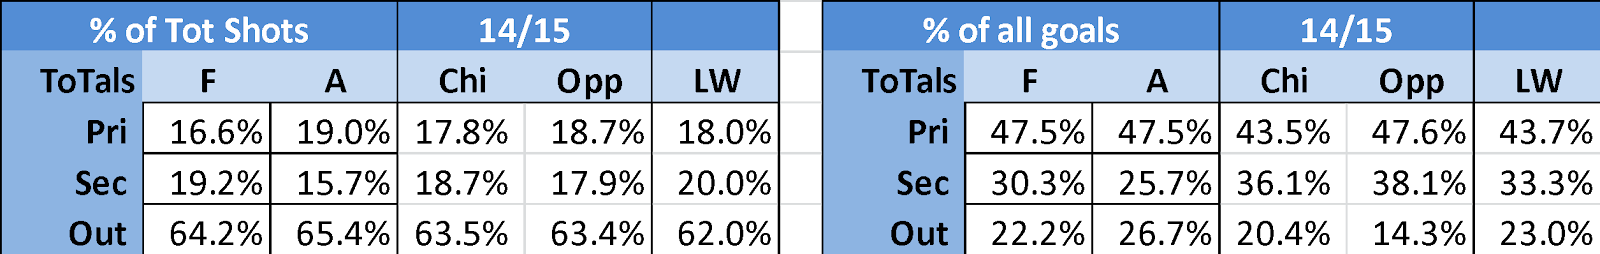
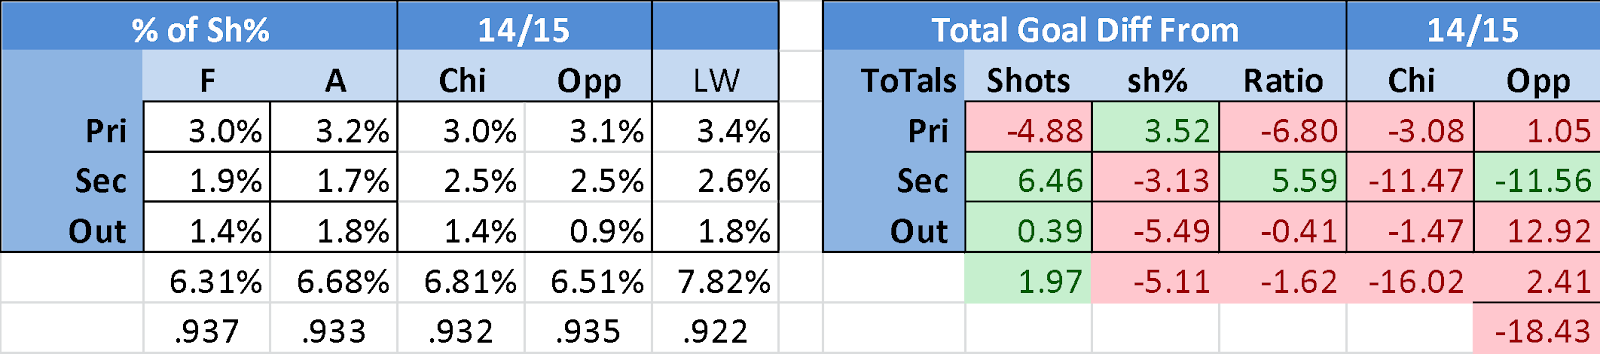
[Left side - Percentage of Total Shot Percentages by Zone compared to Last Season. Right side - League Average, same except for Goals]
[Left side - Total Goals compared to Last Season and League Average. Right side – same comparison but for Total Expected Goals]

[Left side – Shooting Percentage x Percentage of shots. This shows what part of overall shooting percentage comes from which zone. Right side – Shows difference in total goals from “more shots”, “difference in shooting percentages”, and “differences in the Ratio of Quality to overall shots,” and comparisons to last season’s average goals per game for 30 games. Note: I’m not looking up actual goals for 30 games just what the average for the season would be for 30 games.]
[Goalie Actual vs Expected Save differential. Same with Shooting Percentages and Expected PDO. Last season the Hawks were at .935 and Opponents were at .932 Actual and closer to .923 Expected]


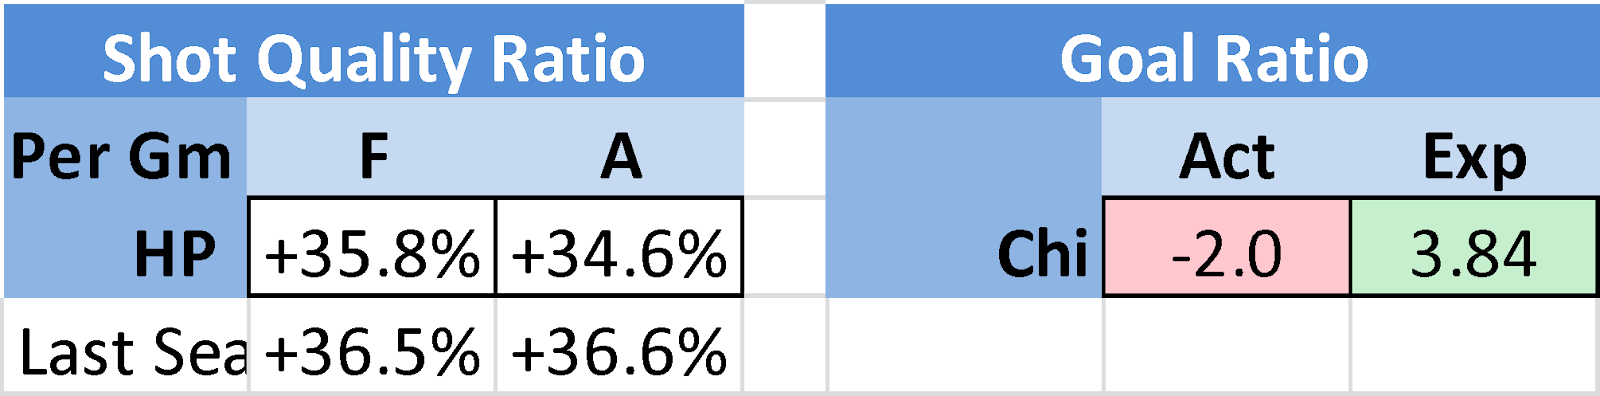
[Ratio of Home Plate Shots to Total Shots. Goal Ratio is Total difference for the 30 games.]
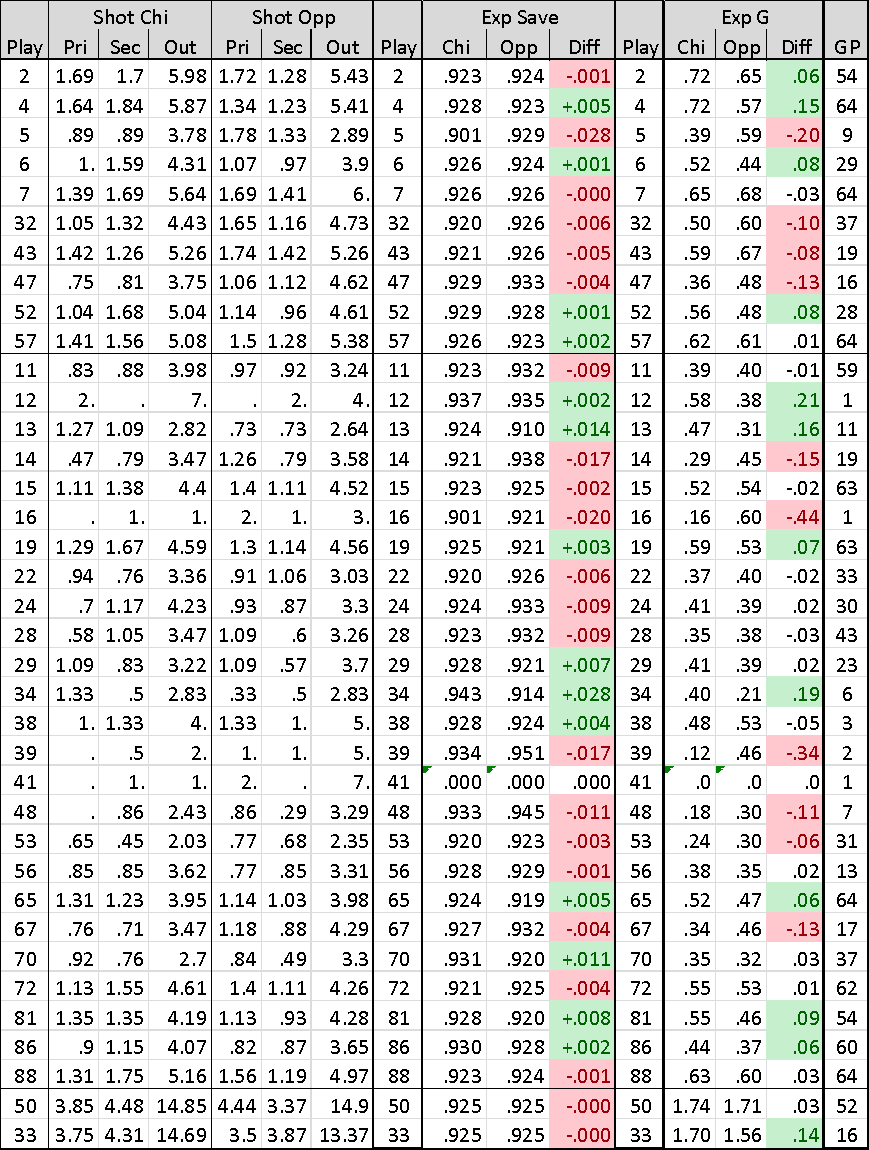
[Results when individual player is on the ice. These are per game stats with Total Expected Goals and Actual Totals Goals added at the end

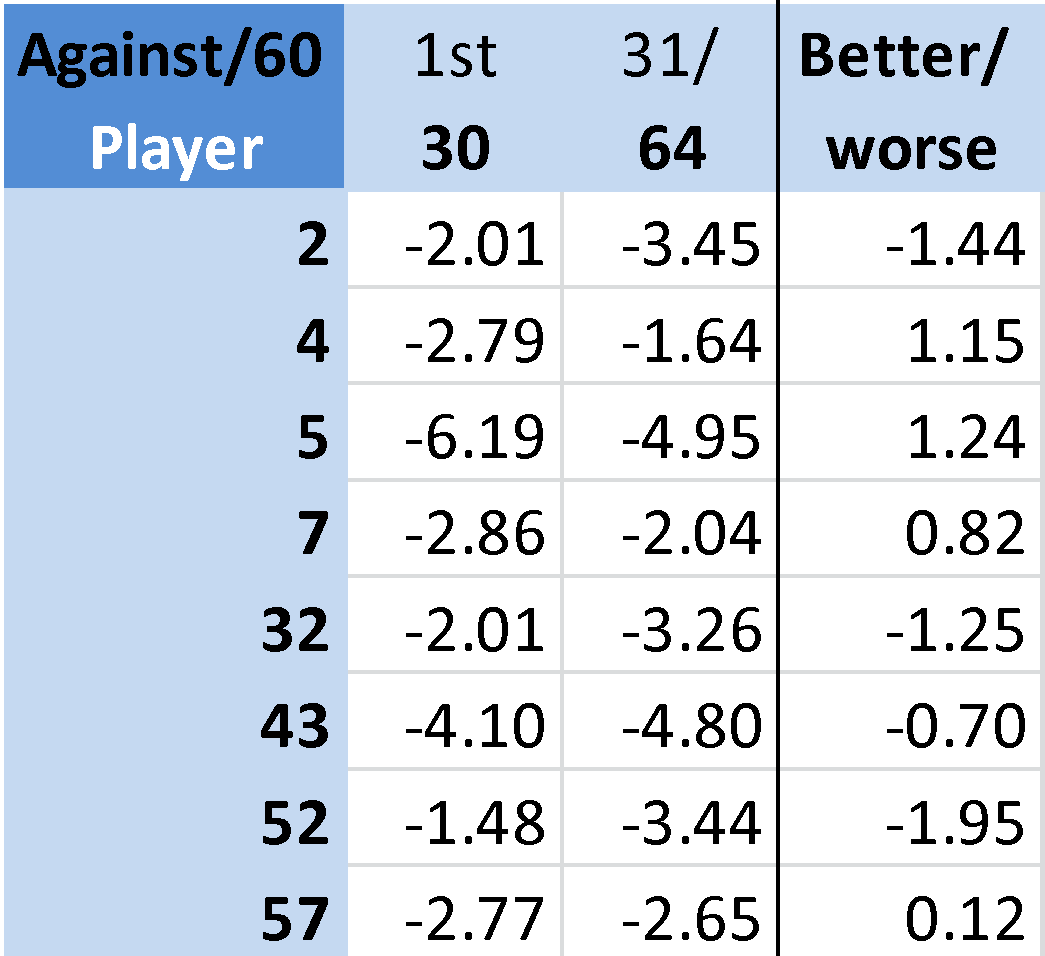
[I give out 1 point for the player I think is most responsible for breaking down the defense to allow a shot. “For” are shots created for the Hawks. “Against” are defensive breakdowns. 1st table is a simple count]
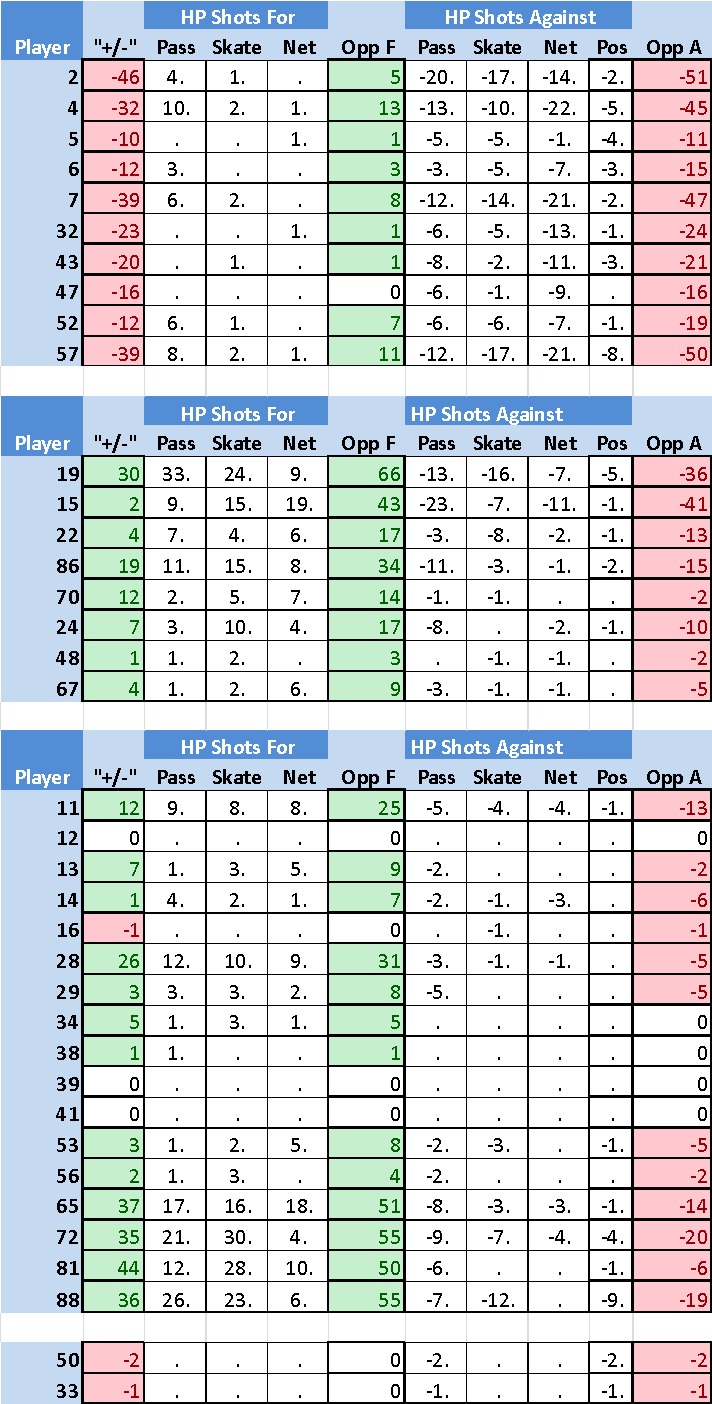
[2nd table compares Actual Goals to Expected Goals from that individual player]
[Note: I am not tracking individual play from shots from the outside.]

[3rd Table is my data per 60 minutes of icetime]
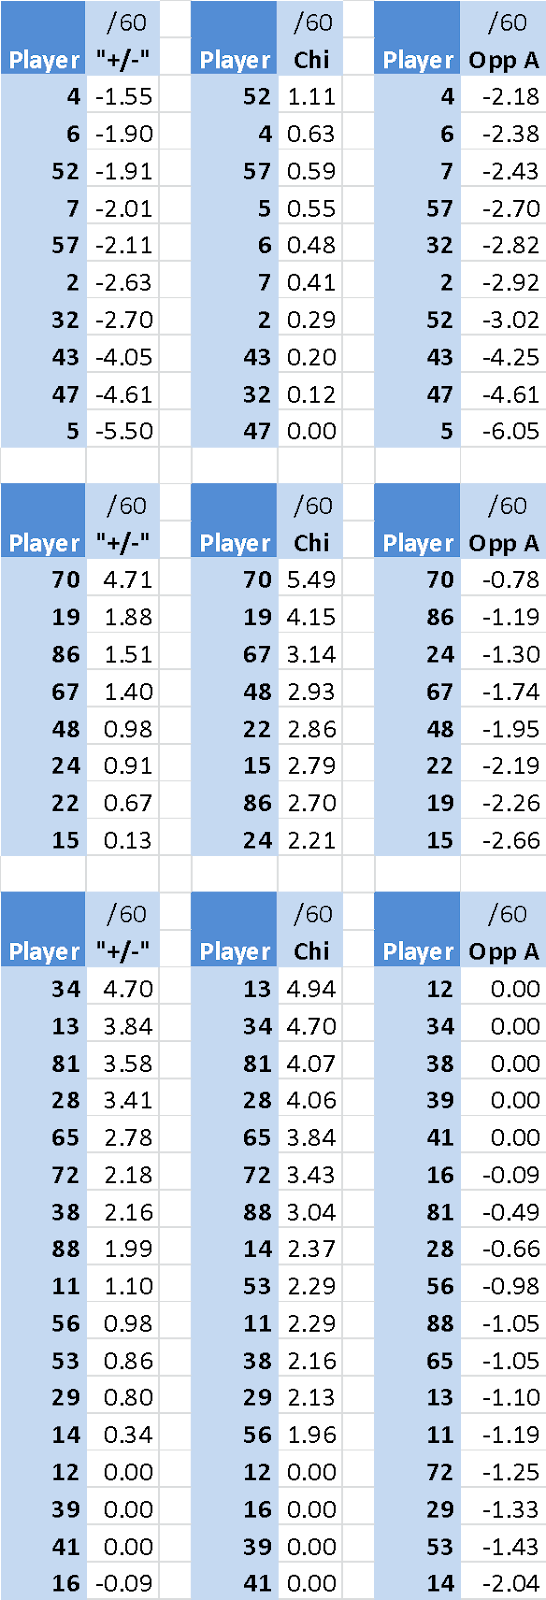
[Shooting percentages by location. Looking for forwards getting more than 36.5% of shots in HP area. Looking for Expected Sh% better than 7.8% an Actual% better than Expected]
